Play with V8 - build, debug and basics
- Published on
Lately, I have been working on customizing V8 which gives me a chance to learn more about V8. In this blog post, I will be sharing my experience of getting started with V8. The topics that will be covered include building V8 from the source, debugging V8, and comprehending V8's compilation pipeline.
Preparation
How to build Node(V8)
building Node with ninja:
https://github.com/nodejs/node/blob/main/doc/contributing/building-node-with-ninja.md
building v8:
https://sytranvn.dev/posts/debug-v8-part-1/
modify the configuration of out/x64.Debug/args.gn
cd out/x64.debug && ninja
How to Debug Node(V8) with gdb
how to debug v8 with gdb https://medium.com/fhinkel/debug-v8-in-node-js-core-with-gdb-cc753f1f32
https://joyeecheung.github.io/blog/2018/12/31/tips-and-tricks-node-core/
how to debug v8 with vscode using gdb https://medium.com/@fengyu214/v8-playbook-1ac3b4b83cb1
{
    "version": "0.2.0",
    "configurations": [
    {
      "name": "Debugger for d8",
      "type": "cppdbg",
      "request": "launch",
      "targetArchitecture": "x64",
      "program": "${workspaceRoot}/out/x64.debug/d8",
      "args": [
        "--expose-internals",
        "test.js"
      ],
      "stopAtEntry": true,
      "cwd": "${workspaceRoot}",
      "MIMode": "gdb",
      "sourceFileMap": { "../../": "${workspaceRoot}" }
    }]
  }
how to debug builtin in v8
https://www.anquanke.com/post/id/260029
https://stackoverflow.com/questions/56857660/debugging-codestubassembler-csa-code-in-v8
To debug the builtin, we could debug the mksnapshot binary which is used to build snapshot.bin.
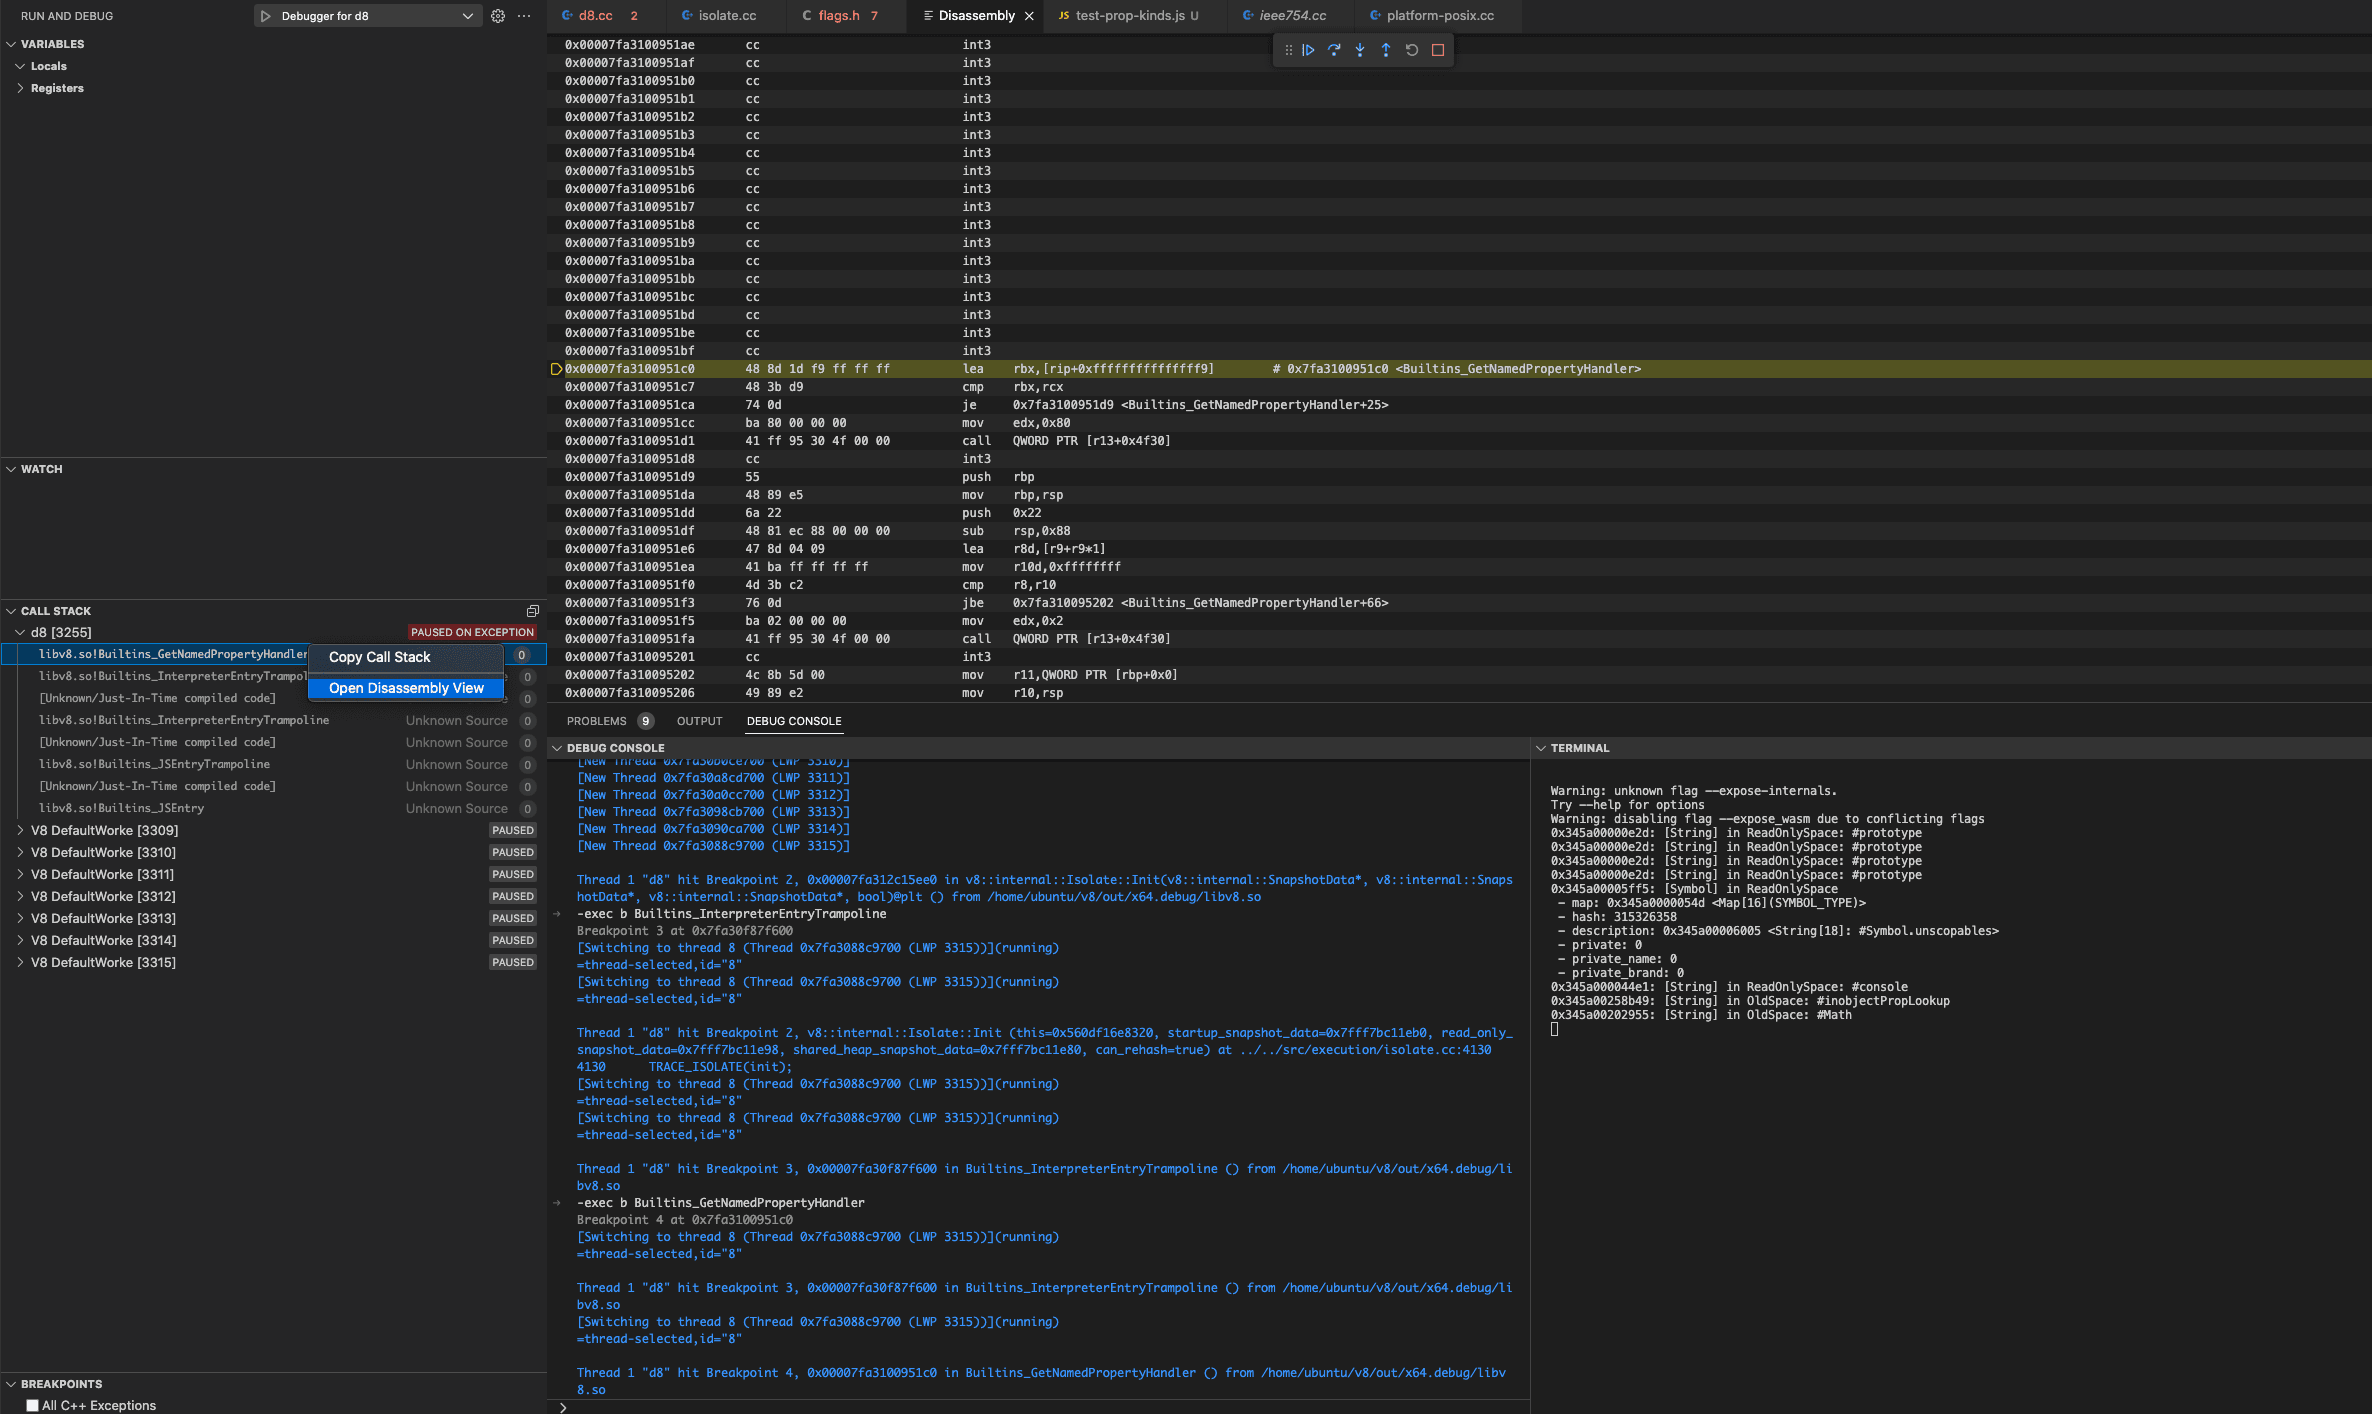
Occasionally, we may desire to track the execution of bytecode and identify which builtin function has been called. To achieve this, we can initially set a breakpoint at b Isolate::Init, which is necessary. Subsequently, upon hitting the first breakpoint(), we can add another breakpoint at b Builtins_InterpreterEntryTrampoline, which serves as the entry point for each builtin function. Finally, to identify the specific builtin handler, such as b Builtins_GetNamedPropertyHandler, we must add a breakpoint, but since the source code is not visible, debugging can only be done through the disassembled code.
If you forget to add breakpoint b Isolate::Init or add the b Builtins_InterpreterEntryTrampoline before hitting the first breakpoint, you may face the following error due to a hash mismatch.
#
# Fatal error in ../../src/execution/isolate.cc, line 327
# Embedded blob code section checksum verification failed. This indicates that the embedded blob has been modified since compilation time. A common cause is a debugging breakpoint set within builtin code.
#
#
#
#FailureMessage Object: 0x7ffec4d37368
how to debug a line of js in v8?
Since we are going to debug v8, which is an interpreter(compiler) meaning that our js code serves a file input, we cannot add a breakpoint directly on the line of the js file of course. However, we could use a trick to view the execution inside of v8 on the line of js code we are interested in.
We could add a Math.cosh(1) line in our javascript code as a breakpoint since we know that cosh has been executed by the builtin written by C++ whose source code is accessible which is located at src/base/ieee754.cc:2554. By setting a breakpoint at that location, we can pause the execution and debug the subsequent code, which is likely the part that processes the next line of our JavaScript code.
When debugging the V8 interval, especially the built-in components, we often encounter situations where the source code is unavailable. In such cases, we may have to resort to debugging the raw disassembled code instead. Usually, while debugging, two kinds of code are mixed together.
function inobjectPropLookup(){
    let obj = {'XXXX':'AAAA'};
    obj['YYYY']='BBBB';
    Math.cosh(1);// b v8/src/base/ieee754.cc:2555
    let prop = obj.ZZZZ
    console.log(prop)
}
Intro to v8: Ignition + turbofan
https://docs.google.com/document/d/11T2CRex9hXxoJwbYqVQ32yIPMh0uouUZLdyrtmMoL44/edit#
Since the birth of v8 in 2008, the compiler pipeline has evolved over years. And finally, after 2017, the compiler pipeline has been generally unified and got rid of the full Codegen and Crankshaft. Currently, the pipeline looks like the graph shown below.
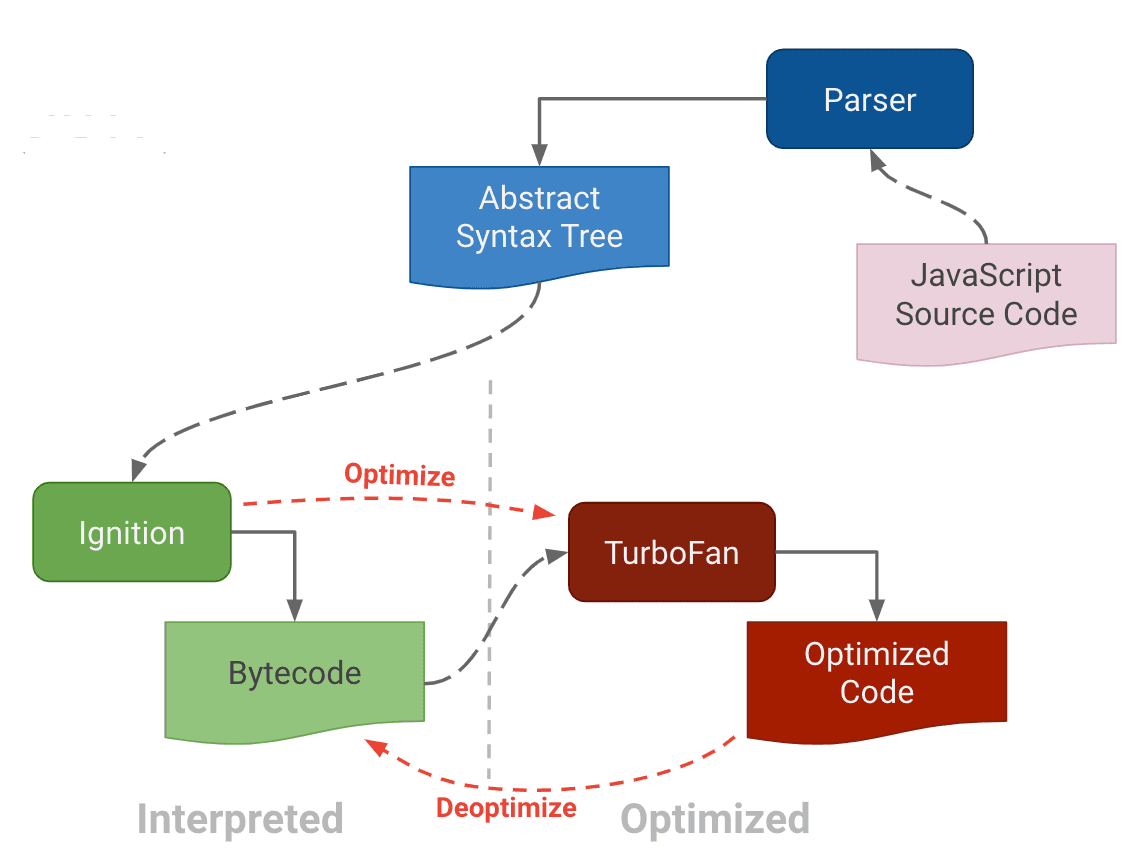
To begin with, the javascript source code undergoes tokenization and parsing to generate an abstract syntax tree (AST). In 2016, a new javascript bytecode interpreter called Ignition was introduced to V8 to reduce memory usage. It utilizes a concise javascript intermediate representation called Bytecode. Ignition interprets or executes the bytecode and identifies the frequently accessed segments or hot parts, which are then passed to TurboFan for heavy optimization and to generate more efficient machine code. Afterward, Ignition would pass the execution of hot parts to turbofan by leveraging the optimized machine code. However, if there is a change in the input type of the hot parts, the optimized machine code must be deoptimized and executed by Ignition using the bytecode.
Ignition
Generally speaking, Ignition has three responsibilities: bytecode handlers generation, bytecode generation, and interpreter code execution.
bytecode handlers generation
The interpreter itself has a set of bytecode handler code snippets, each of which handles a specific bytecode and dispatches it to the handler for the next bytecode. These bytecode handlers are written in C++ by using the low-level, architecture-independent macro-assembly instructions provided by TurboFan. These bytecode handlers would be compiled into machine instructions during the compilation of v8 and will be included in the startup snapshot and deserialized when a new isolate is created. Therefore, these bytecode handlers in machine code would be invoked directly when the ignition starts to interpret the bytecodes during the runtime.
A simple code snippet for the Mov bytecode handler is shown below.
// Mov <src> <dst>
//
// Stores the value of register <src> to register <dst>.
IGNITION_HANDLER(Mov, InterpreterAssembler) {
  TNode<Object> src_value = LoadRegisterAtOperandIndex(0);
  StoreRegisterAtOperandIndex(src_value, 1);
  Dispatch();
}
An important thing that should be noted is that bytecode handlers are generated ahead of runtime and saved in the snapshot_blob.bin. If you want to debug the Ignition_handler, you need to use Print instead of printf. Since Print would insert an instruction to print out the information in the runtime, however, printf would only print during the compilation.
bytecode generation
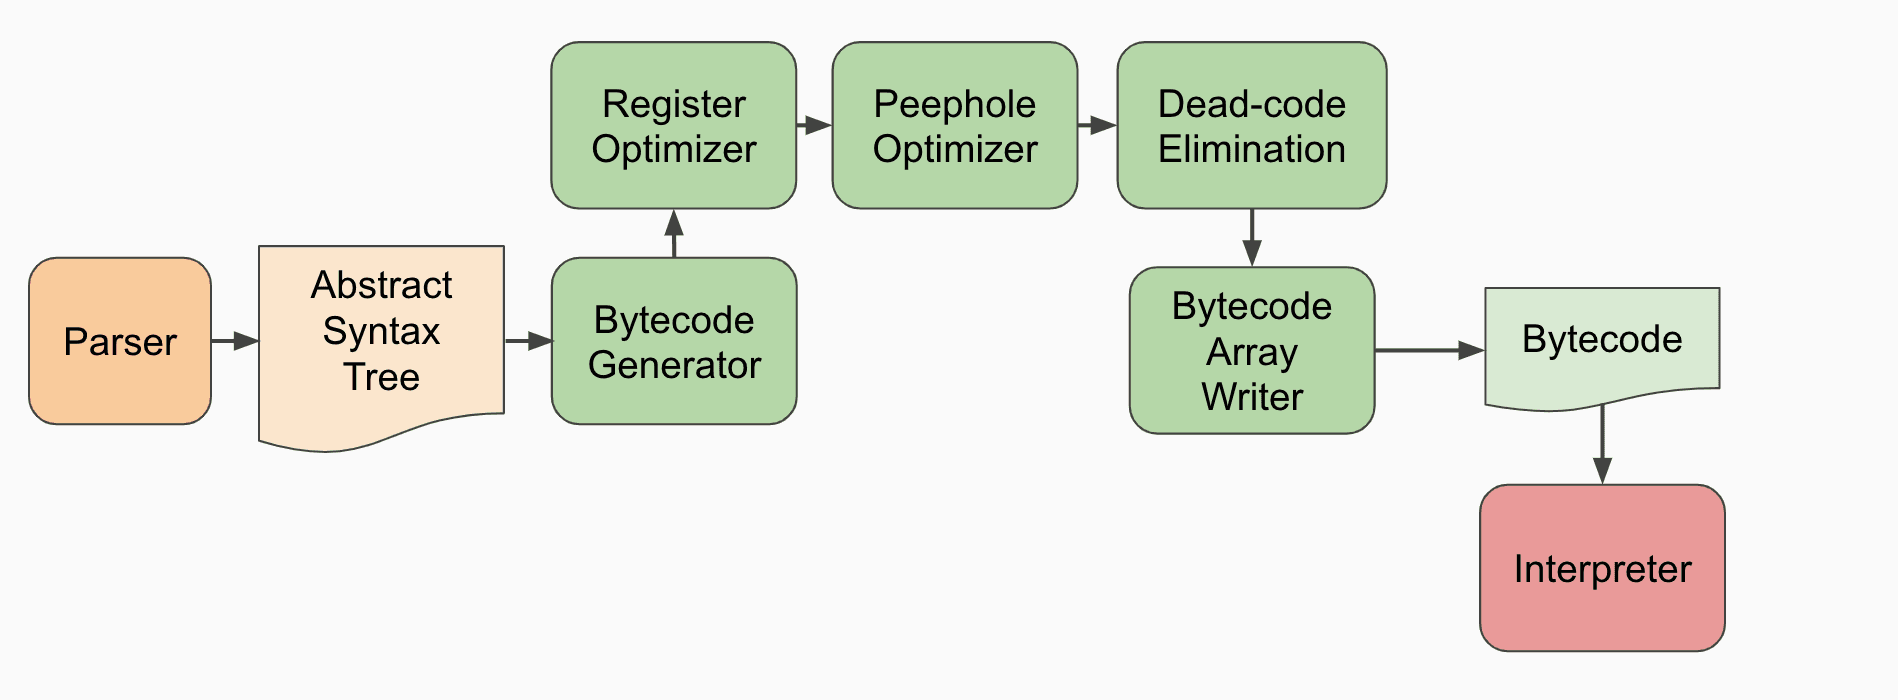
In order to be run by the interpreter, a function is translated to bytecode by a BytecodeGenerator during its initial unoptimized compile step. The BytecodeGenerator is an AstVisitor that walks the function’s AST emitting appropriate bytecodes for each AST node. And it also does inline optimization for the bytecodes, since you could also view this part as a compiler for translating javascript to the bytecode.
interpreter code execution
The Ignition interpreter is a register-based interpreter. These registers are not traditional machine registers but are instead specific slots in a register file that is allocated as part of a function’s stack frame. Bytecodes can specify the input and output registers on which they operate through bytecode arguments, which immediately follow the bytecode itself in the BytecodeArray stream.
When a function has been called at runtime, the InterpreterEntryTrampoline stub is entered. This stub set up an appropriate stack frame, and then dispatch to the interpreter’s bytecode handler for the function’s first bytecode in order to start the execution of the function in the interpreter. The end of each bytecode handler directly dispatches to the next handler via an index into the global interpreter table, based on the bytecode.
bytecode handler, code stub and builtin
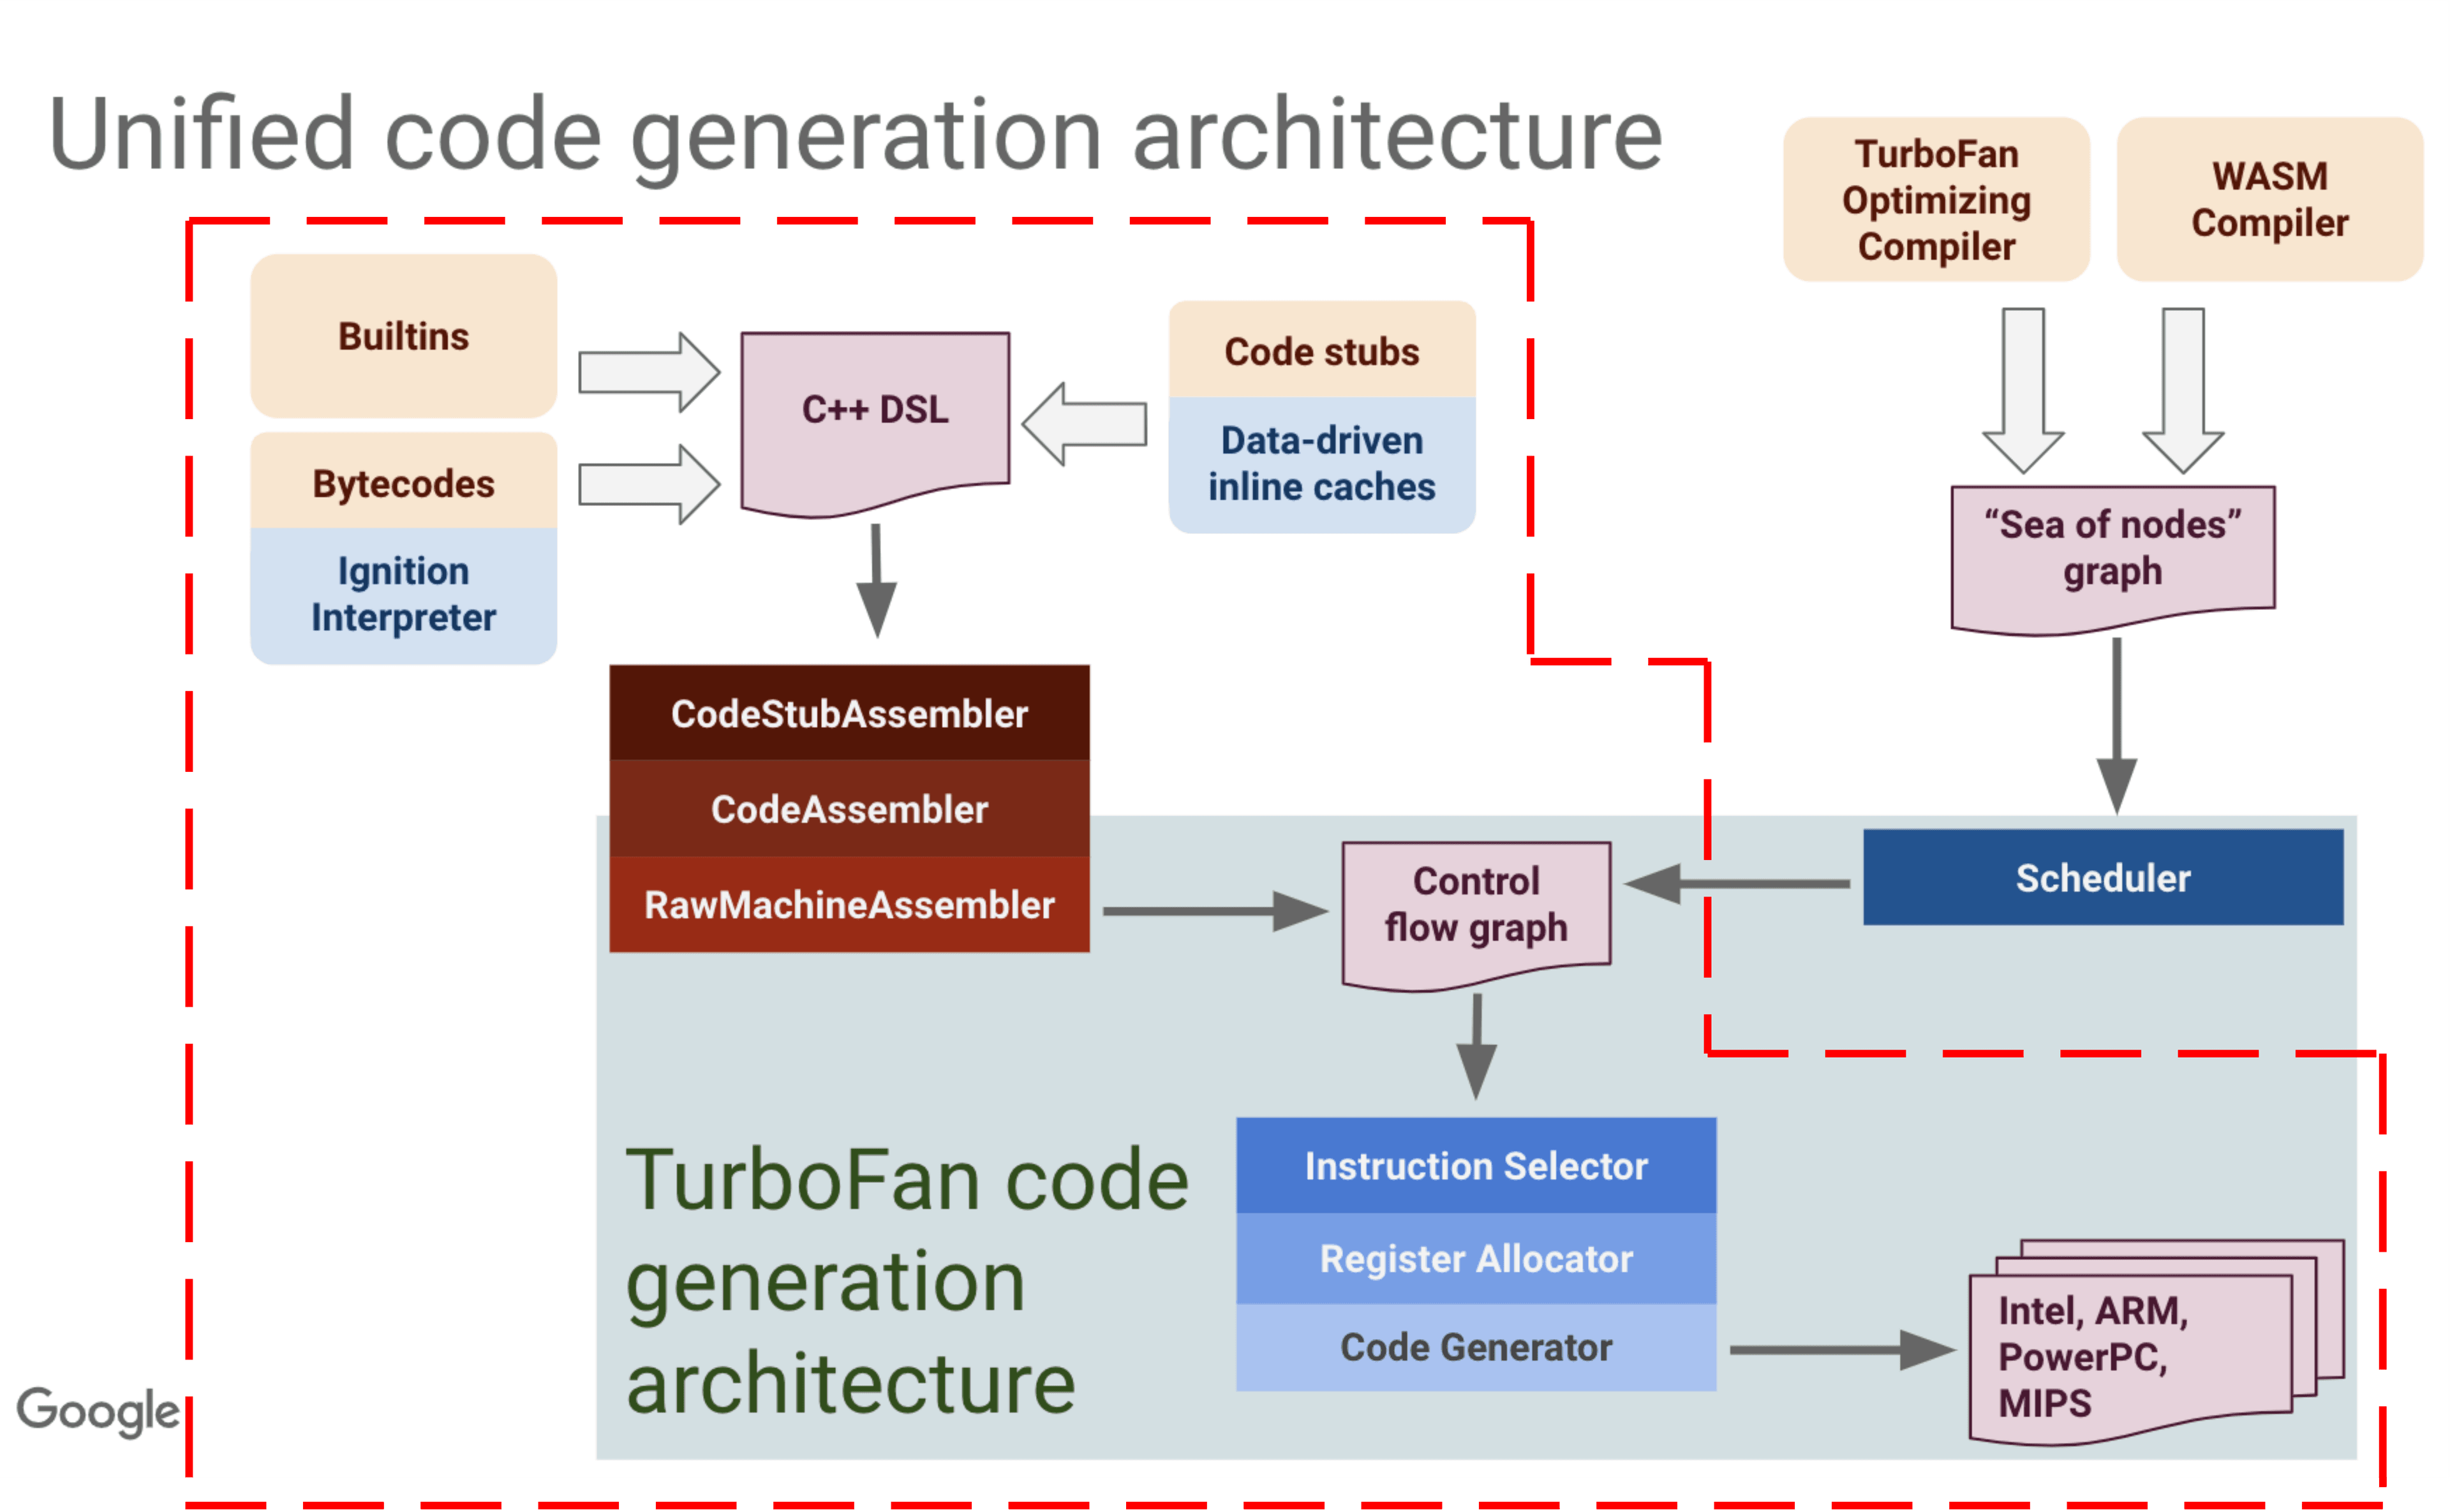
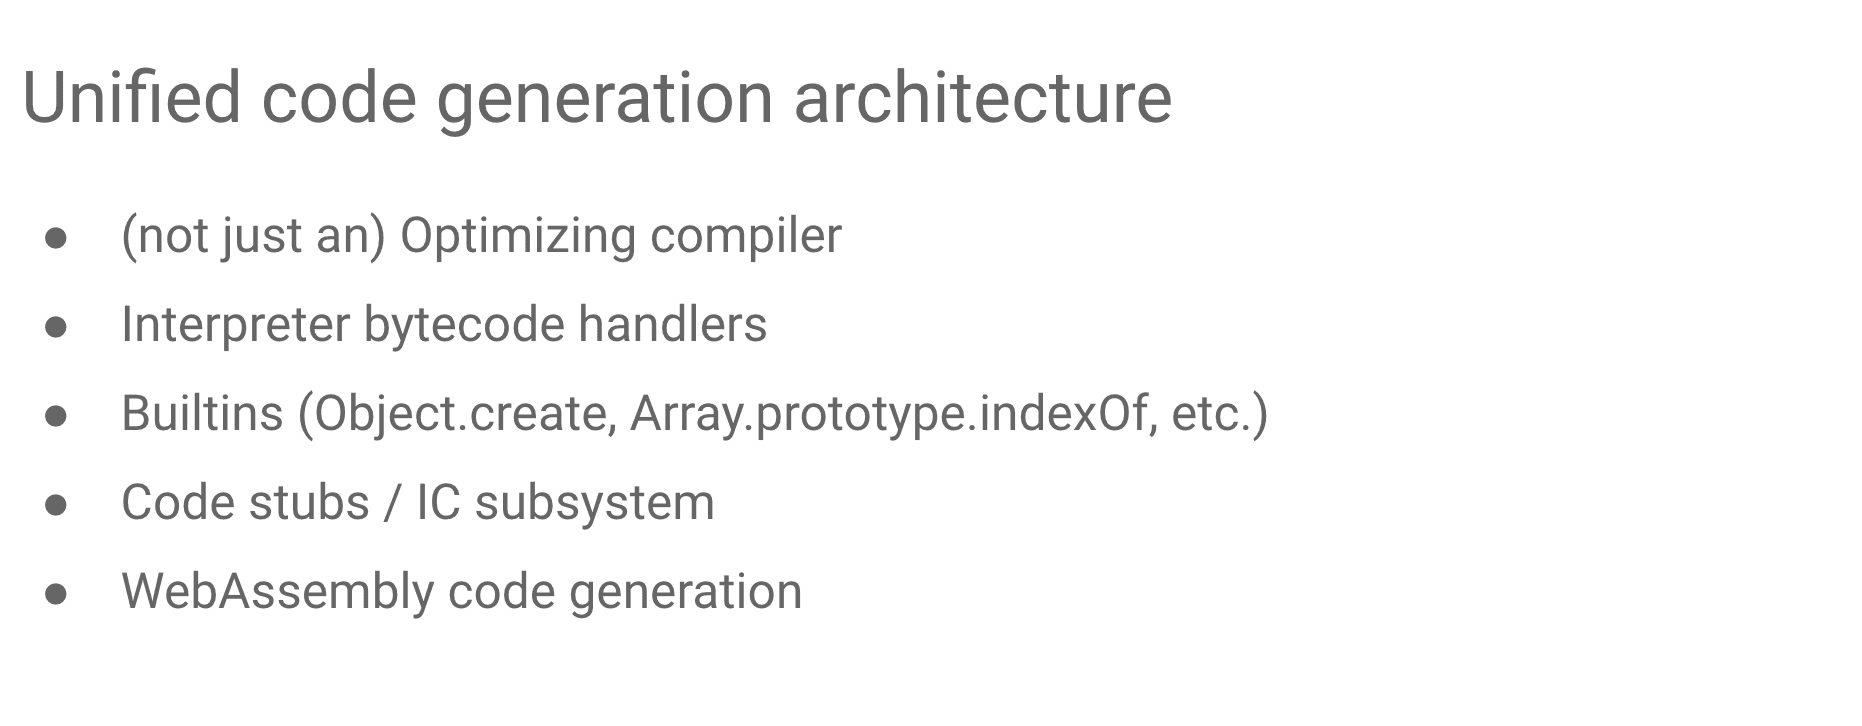
Besides bytecode handlers, there are also code stubs like InterpreterEntryTrampoline that help the execution process and builtins like Array.prototype.slice() which will also be compiled by TurboFan into snapshot during the compilation of v8. TurboFan is not only an optimizing compiler but also a unified code generation architecture provided to the upper layer that helps to generate machine codes.
TurboFan
I don't want to delve into details about TurboFan as it's not directly related to my current work. However, there are several essential points to be aware of.
an optimizing compiler
Firstly, TurboFan is an optimizing compiler that combines a cutting-edge intermediate representation with a multi-layered translation and optimization pipeline to generate better-quality machine code than what was previously possible with the CrankShaft JIT. Optimizations in TurboFan are more numerous, more sophisticated, and more thoroughly applied than in CrankShaft, enabling fluid code motion, control flow optimizations, and precise numerical range analysis, all of which were previously unattainable.
More details about turbofan can be found here.
However, the turbofan conducts heavy optimization on a set of bytecodes which costs more time and memory usage. It needs to collaborate with the ignition interpreter to provide good performance for the distributed program like javascript on the webpages.
a unified code generation architecture
According to Benedikt Meurer who leads the turbofan project, turbofan is also a unified code generation architecture. Just like what we have seen before, besides runtime, turbofan also helps to generate machine code for bytecode handlers, builtins, and code stubs for the interpreter. These codes will be saved in the snapshot and loaded directly during the run-time.
Object and properties in V8
Reference:
According to the document, there are three different named property types: in-object, fast, and slow/dictionary:
- In-object properties are stored directly on the object itself and provide the fastest access.
- Fast properties live in the properties store, all the meta information is stored in the descriptor array on the HiddenClass.
- Slow properties live in a self-contained properties dictionary, meta information is no longer shared through the HiddenClass.
in-object properties in v8
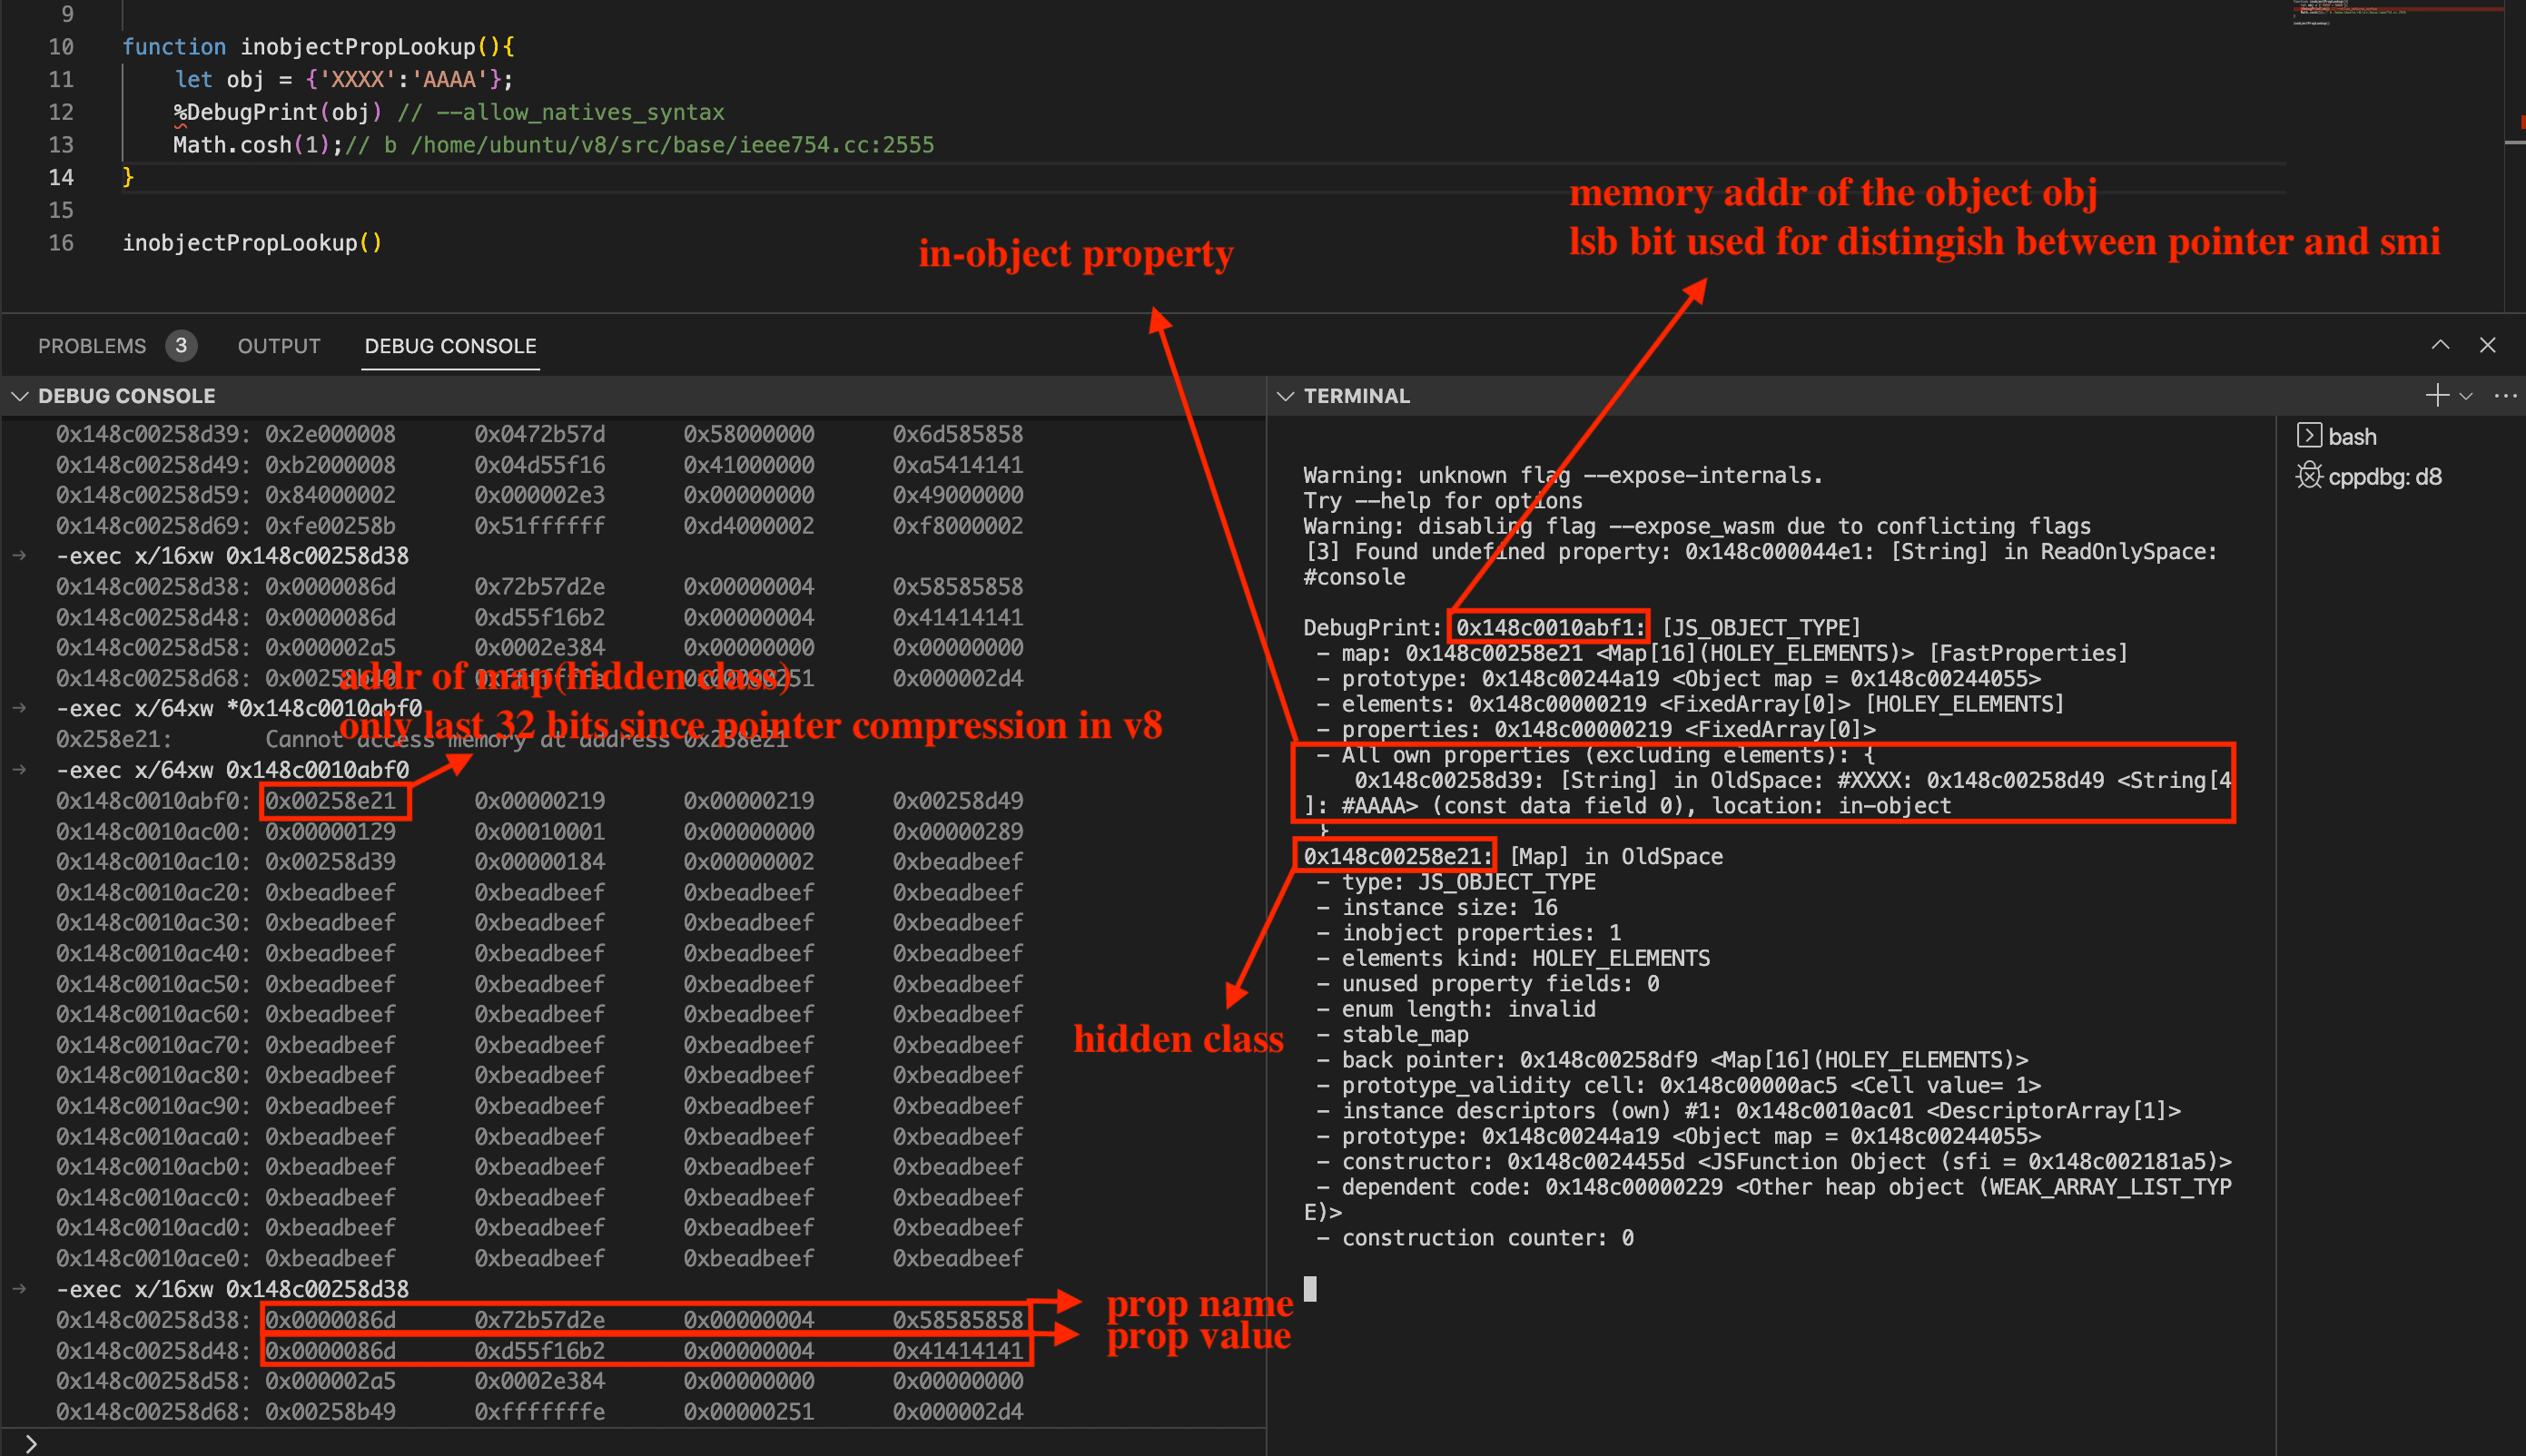
The memory layout of a js object with the in-object property looks like the following figure. It should be noted that v8 uses pointer compression which is the reason why we only can view 32 addr in the memory. And it uses lsb to distinguish smi and pointer, so we need to -1 for every print address.
fast properties